Movie Rentals
Introduction
Problem:
A brick-and-mortar movie rental company, Rockbuster Stealth, started to experience declining sales due to competition from streaming services, such as Netflix and Amazon Prime. Rockbuster wanted to transition to an online video rental service using their existing movie licenses. To achieve a successful transition, I analyzed their current sales by film, region, and customer.
Context:
I carried out this analysis as a student for a project in CareerFoundry's Data Analytics Program. The purpose of this project was to become familiar with SQL skills commonly used by data analysts.
Goal:
My goal was to help Rockbuster focus on investing in areas where they achieved the most success in recent years.

Tools:
- PostgreSQL
- Tableau
- PowerPoint
Data:
- Film
- Film Category
- Category
- Film Actor
- Actor
- Language
- Customer
- Staff
- Address
- Store
- City
- Country
- Inventory
- Rental
- Payment
To view the data set or database as a .tar file, click here.
Process
Process Steps:
| Step | Skills | Purpose |
|---|---|---|
| 1. Learning about databases and relationships | Learned about keys, indexes, data types, and relational database schemas. Additionally, created entity relationship diagram (ERD). | Understood how tables and columns are related and printed diagram for easier querying. |
| 2. Using four basic operations types | Learned and executed CRUD operations (create, read, update, and delete), SELECT queries, and contraints. | Learned how to create, remove, and update information, limit the information to ensure correct input, and understand basic querying. |
| 3. Data exploration by sorting and filtering data | Explored film tables as well as rental rates and duration using GROUP BY, ORDER BY, aggregated functions, as well as WHERE and HAVING clauses. | Viewed important numerical and non-numerical data by category, important for answering business questions and planning further analysis. |
| 4. Data profiling and cleaning | Learned techniques for profiling data and finding duplicate records, non-unique values, and missing values. | Cleaned data for smoother analysis and visualization steps. |
| 5. Looking at data by region | Used JOINS, subqueries, and CTEs to look at customer data by city and country for later visualizations. | Returned important information regarding customer expenditure and customer count by region. |
| 6. Putting it all together | Used all techniques learned to return final result sets desired for visualizations and presentation. | Put results in Tableau to create visualizations and put together final presentation in PowerPoint. |
Asking the Right Questions:
The client, a brick-and-mortar movie rental company named Rockbuster Stealth, needed a strategy to transition their business model to online sales. In the process, I looked at their current busines trends, including what films, countries, and cities generated the most revenue. The queries below were written in PostgreSQL, while the visualizations were created by uploading the result sets from the SQL queries into Tableau.
SELECT F.film_id,
F.title,
F.release_year,
F.rental_duration,
F.length,
F.rental_rate,
SUM(PY.amount) AS revenue
FROM film F
INNER JOIN inventory I ON F.film_id = I.film_id
INNER JOIN rental R ON I.inventory_id = R.inventory_id
INNER JOIN payment PY ON R.rental_id = PY.rental_id
GROUP BY F.film_id, F.title, F.release_year, F.rental_duration, F.length, F.rental_rate
ORDER BY revenue DESC
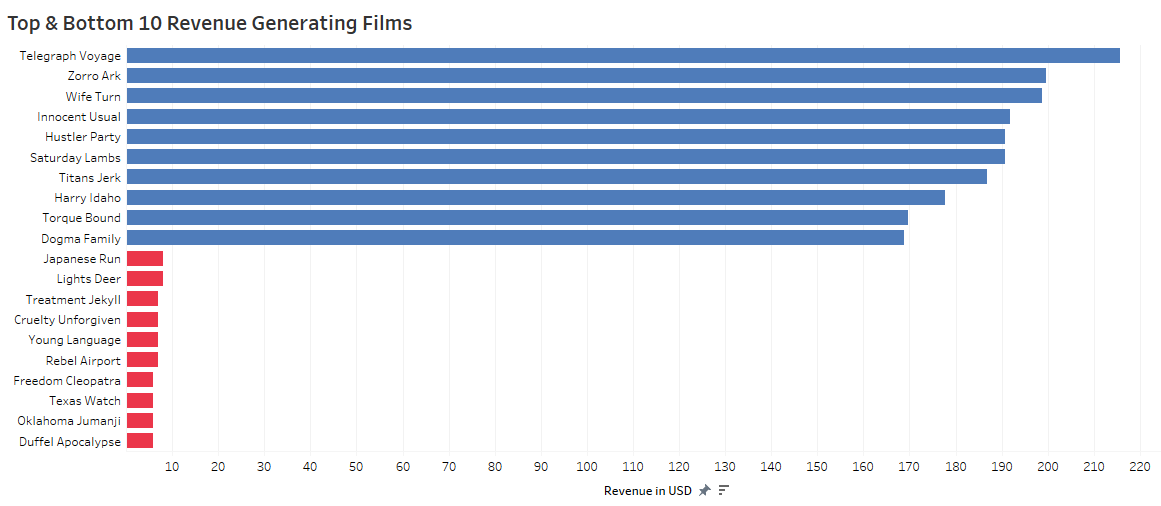
/* This query creates a result set that shows the top and bottom 10 revenue generating films rented by Rockbuster Stealth. */
SELECT COUNT(CS.customer_id) AS customer_count, CT.country
FROM customer CS
INNER JOIN address AD ON CS.address_id = AD.address_id
INNER JOIN city CY ON AD.city_id = CY.city_id
INNER JOIN country CT ON CY.country_id = CT.country_id
GROUP BY country
ORDER BY customer_count DESC
LIMIT 10;
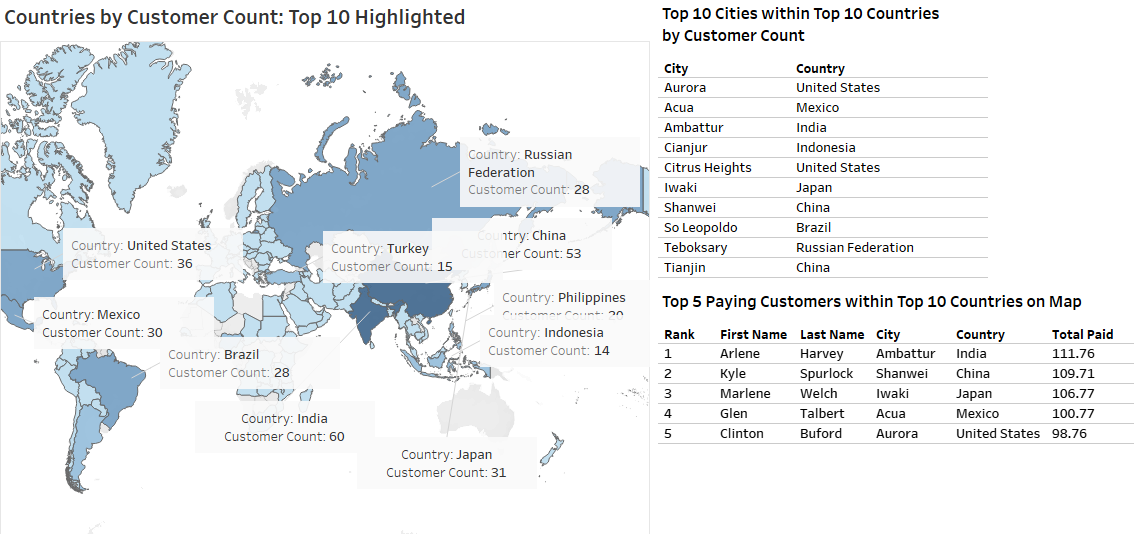
/* The query above creates a result set that shows the top 10 revenue generating countries the client serves. */
SELECT COUNT(CS.customer_id) AS customer_count, CT.country, CY.city
FROM customer CS
INNER JOIN address AD ON CS.address_id = AD.address_id
INNER JOIN city CY ON AD.city_id = CY.city_id
INNER JOIN country CT ON CY.country_id = CT.country_id
WHERE CT.country IN ('India','China','United States','Japan','Mexico','Brazil','Russian Federation',
'Philippines','Turkey','Indonesia')
GROUP BY CT.country, CY.city
ORDER BY customer_count DESC
LIMIT 10;
/* The query above creates a result set that shows the top 10 revenue-generating cities within the
top 10 revenue-generating countries. */
SELECT CS.customer_id, CS.first_name, CS.last_name, CT.country, CY.city, SUM(PY.amount) AS amount_spent
FROM payment PY
INNER JOIN customer CS ON PY.customer_id = CS.customer_id
INNER JOIN address AD ON CS.address_id = AD.address_id
INNER JOIN city CY ON AD.city_id = CY.city_id
INNER JOIN country CT ON CY.country_id = CT.country_id
WHERE CY.city IN ('Aurora','Acua','Citrus Heights','Iwaki','Ambattur','Shanwei','So Leopoldo',
'Tianjin','Cianjur')
GROUP BY CS.customer_id, CS.first_name, CS.last_name, CT.country, CY.city
ORDER BY SUM(PY.amount) DESC
LIMIT 5;
/* Finally, the query above creates a result set that shows the top 5 revenue-generating customers within the
top 10 revenue-generating cities from the previous query. */
Recommendations
Next Steps:
The goal of the following recommendations was to guide Rockbuster Stealth in focusing their marketing efforts and spending where they are likely to generate the most revenue in their transtion to an online sales business model.

- For this new effort, the focus should begin on offering online rentals in the top 10 countries with the greatest sales as Rockbuster’s budget allows: India, China, Japan, US, Mexico, Brazil, Russia, Philippines, Turkey, Indonesia.
- Begin marketing efforts and reaching out to customers in the following countries (same list as above), as Rockbuster’s budget allows. Put more focus in populated cities, starting with top city by customer count in each of these countries.
- Currently, the average price of Rockbuster’s rentals are around $3 and a 5-day rental duration. Compare this with the average streaming services and adjust the price competitively. If this service is similar to Redbox, as in rental kiosks, the price must be somewhat lower than streaming rentals to compete with the convenience of streaming services.
- Start with the highest revenue-generating films first, whatever the budget allows, whether this is the top 10, 100, or 500 movies. Also allow budget for the purchase of new releases.
Retrospective:
If I were to add to this analysis, I might acquire additional data to help me determine if online sales trends, especially regional trends, are expected to be the same as sales from the client's brick-and-mortar stores. I may also monitor these trends and conduct forecasts over time. I would also conduct other analyses on future online sales to determine if there is any seasonality in sales numbers. Additionally, some may wonder why I did not look at sales by genre and gather other important data in my analysis of the orginal data. I did do this in fact. I am not showcasing the results here because they were not significant. For example, sales did not differ significantly by genre or other other category not listed in this case study.
For More:
To view PostgreSQL scripts, visualizations, or view the data dictionary for this project, click the link below.